Originally posted by: Moth3rThat code is all double dutch (sorry Arnie!) to me as well. Damn forum software.

Putting it simply, for people with simple brains like me:
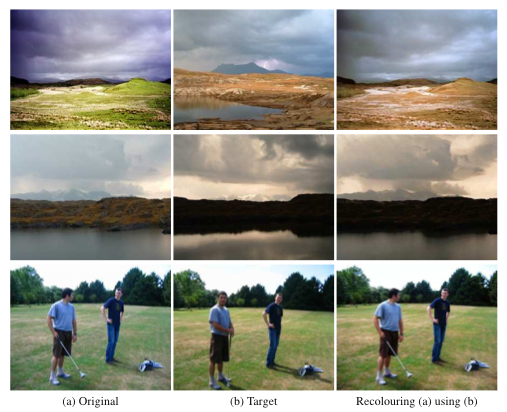
Lets say you have a frame of video, so many pixels, each pixel has a value for Y, U and V. (Could also work in RGB?)
Draw a bar chart - or histogram - for the Y (luminance) values; the x axis as the values from 0 to 255 and the y axis is the number of pixels having that particular Y value. The shape you end up with is governed by the "look" of the image; Mike Verta gives a good editorial on his page
here (read the bit titled "crunch time".
A probability density function produces a curve that approximates to the shape of the graph (the function called the normal distribution is the one most people have heard of).
The process that Laserman is describing is a method of generating a function that produces a curve approximating to video 1's histogram, then adjusting the values of video 2 so that they match this curve.
I would love to see someone with coding ability take this on and come up with an AVISynth filter. Have you tried the AVISynth development forum at doom9 to see if there's any interest?